Visual Analytics
Project Background
Public transport is an imperative part of an infrastructure as millions of people use public transport system for their daily commute. In Singapore, about 70% of the population use public transport (bus/MASS rapid transport/light-rail transit). The public transportation system provides services to commuters’ various routes (Chua & Wang, 2020). The trips they make provide us with enormous amount of commuting data points of interest including information on origin, destination, time of travel, distance travelled, and location of travel. We can gain insights on commuters’ behaviours and travelling patterns by analysing such datapoints.
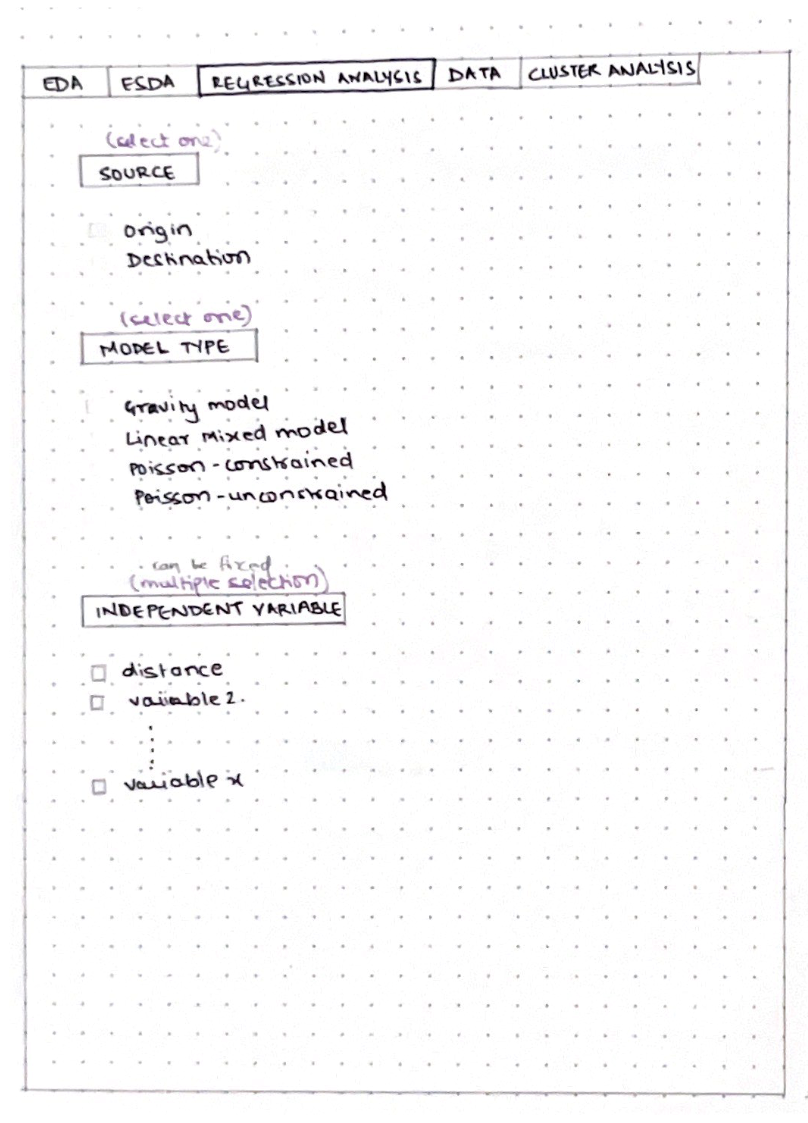
In this study, we will focus on Singapore public bus transport and explore the data about passenger volume through bus trips at bus stop, subzone, and planning area level. We plan to run various models such as Gravity Model, Linear Mixed Model, Regression, and Clustering. The insights generated on public commuting will allow us to have an integrated view of the flow of people in different subzones, the time of the trips, and the primary factors that most influence the patterns of commuting.
Motivation
The digital age has allowed us to have access to large amounts of data. With EZ-Link cards as well as credit and debit cards tapping in and out, we can collect the origin and destination information of commuters. By analysing this information, the relevant authorities can make decisions that are data-backed rather than intuition.
The availability of such data provides us with an opportunity to work on information that is current. By integrating geospatial data with aspatial information will allows us to run different models to gain insights on passenger flow patterns. However, little research has been conducted using public bus commute information of Singapore. Appropriate data analysis and insights can be pertinent for the Land Transport Authority (LTA) and urban planners to plan new bus routes, upgrade and maintain the existing ones, resolve logjams, and allocate budgets to carry out these tasks. Furthermore, these insights can also support policy formulation and decision making for development plans in the future. It is thus important and necessary to interpret information from these trips and turn the data into statistical insights that can reveal the key factors affecting the patterns of commuting flows.
Objective
The project aims to deliver an R-Shiny app that provides:
Interactive user interface design with multiple filter levels, allowing for a deep dive view
Geospatial information interfaced with a visual map representation
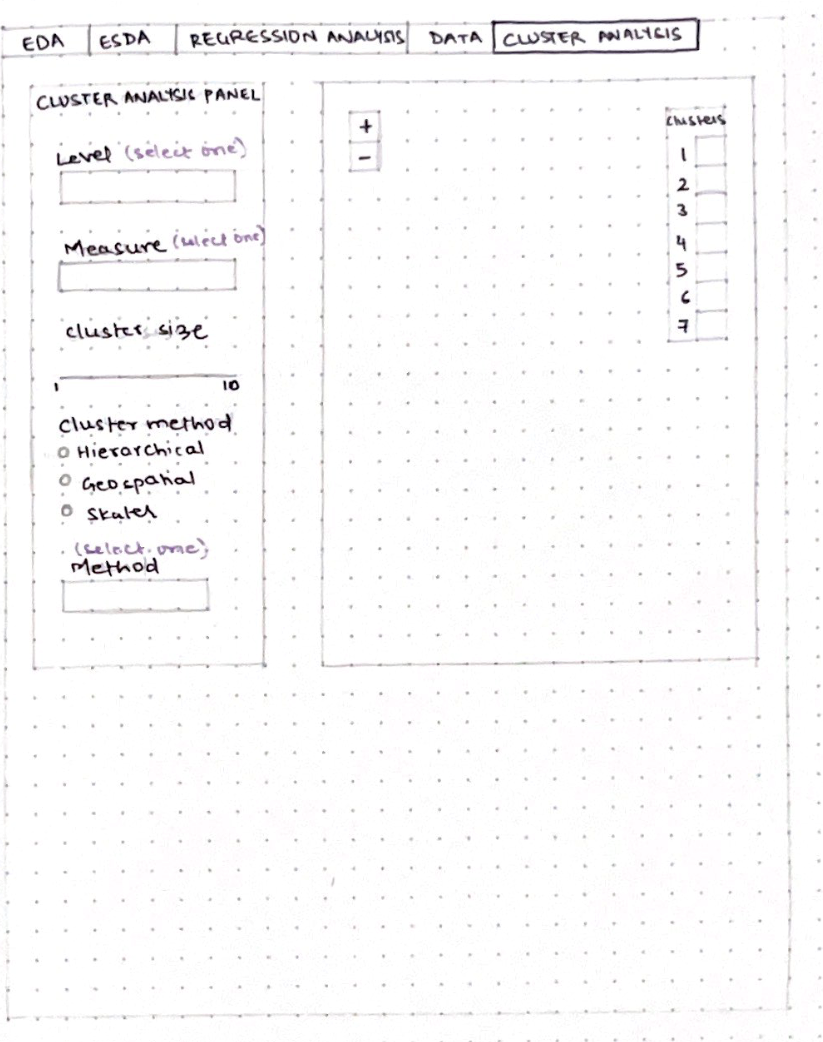
Clustering techniques based on geospatial data
Time series analysis using temporal data
Regression models based on aspatial and geospatial data
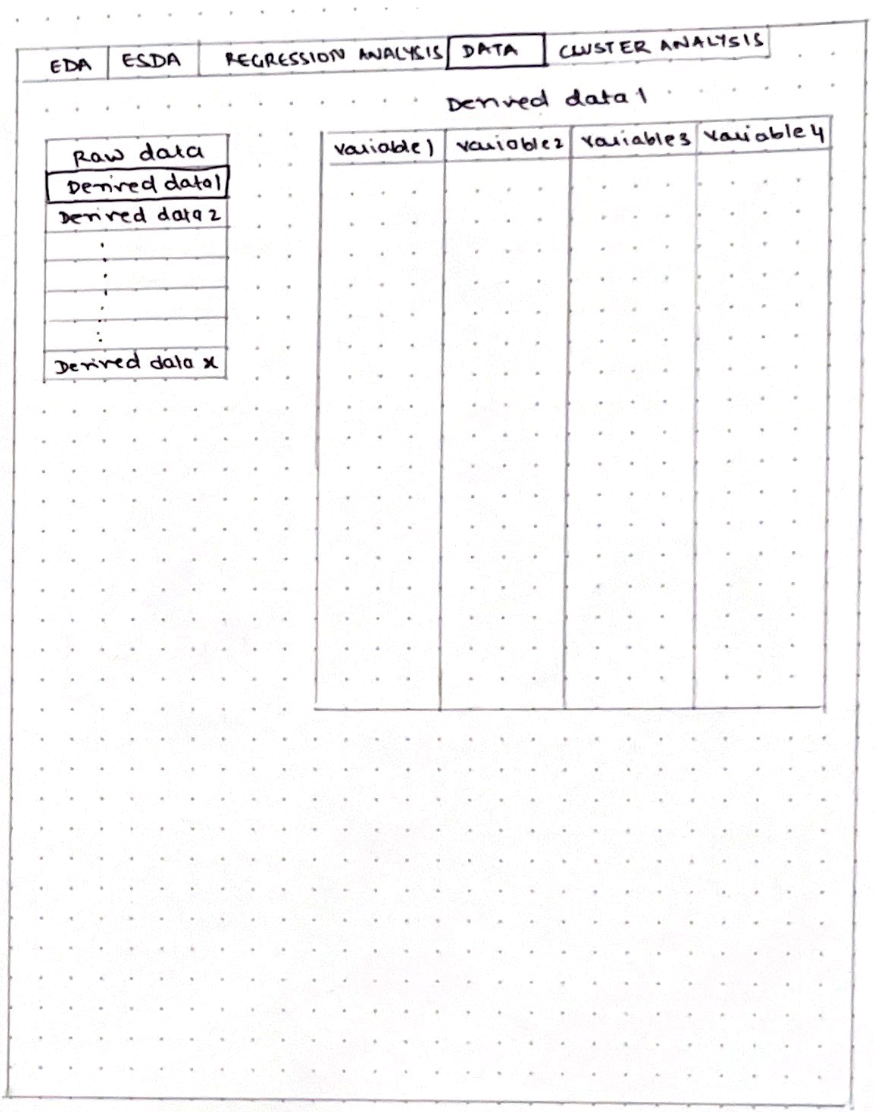
Data
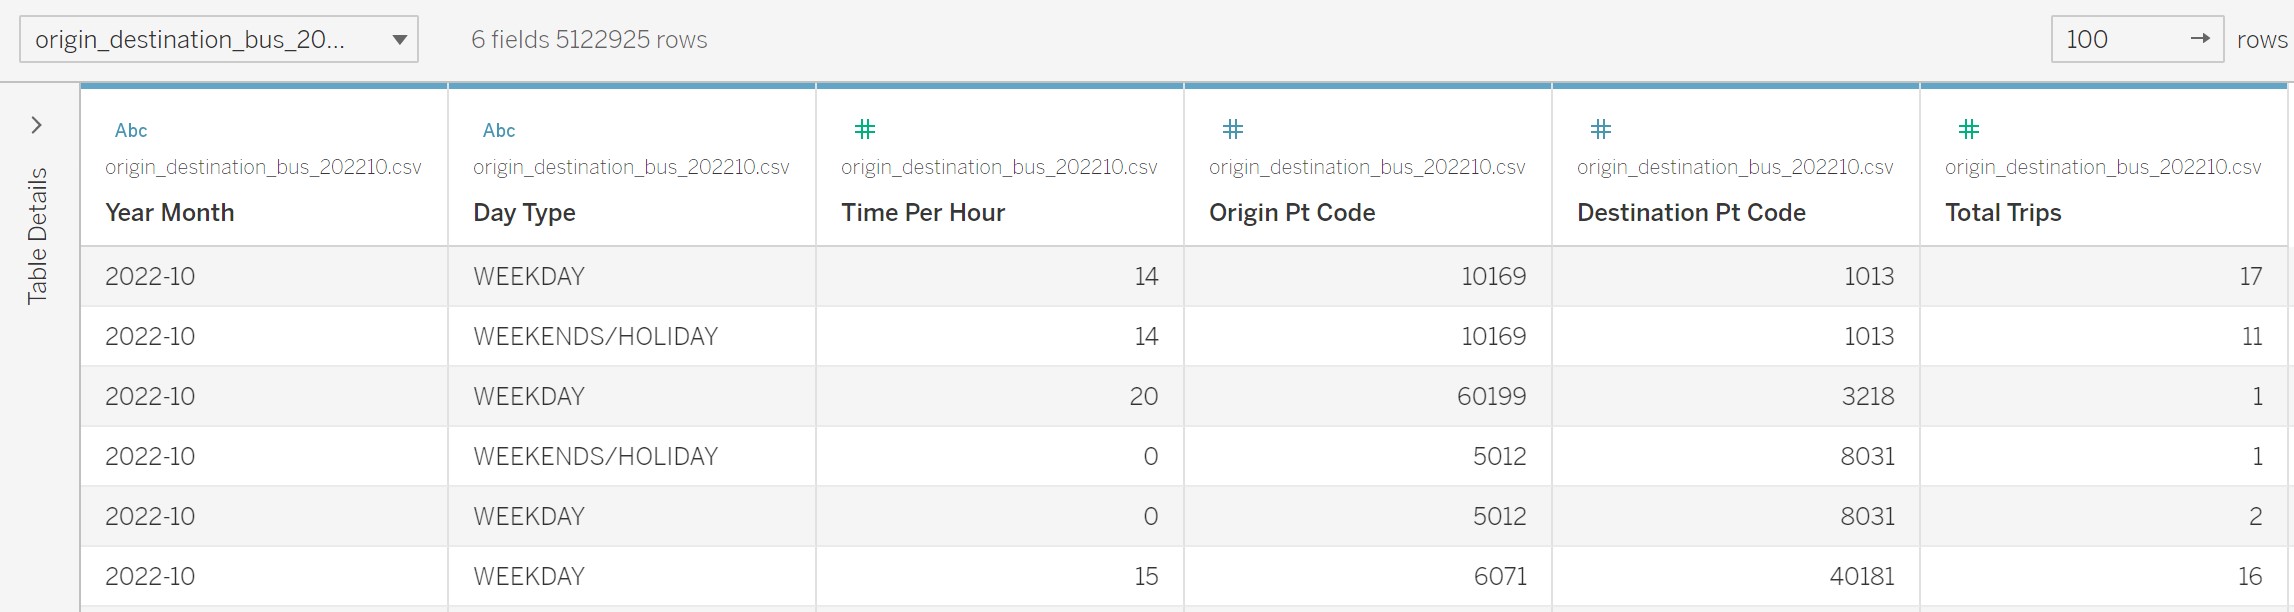
The datasets used in this project were provided at LTA Data Mall. For this project, we obtained the passenger commuting data in 3 month, i.e. Oct 2022 to Dec 2022. Each trip’s information describes its original bus stop, destination bus stop, passenger’s entry timestamp (in hour) and whether on weekdays or weekends/holidays. An example of Oct 2022 passenger bus commuting data is as shown.
Moreover, we have 5 other datasets contain the information of each bus stop, each subzone, each planning area, each region of Singapore as well as the distance between each subzone. Four of the data sets are spatial data sets.
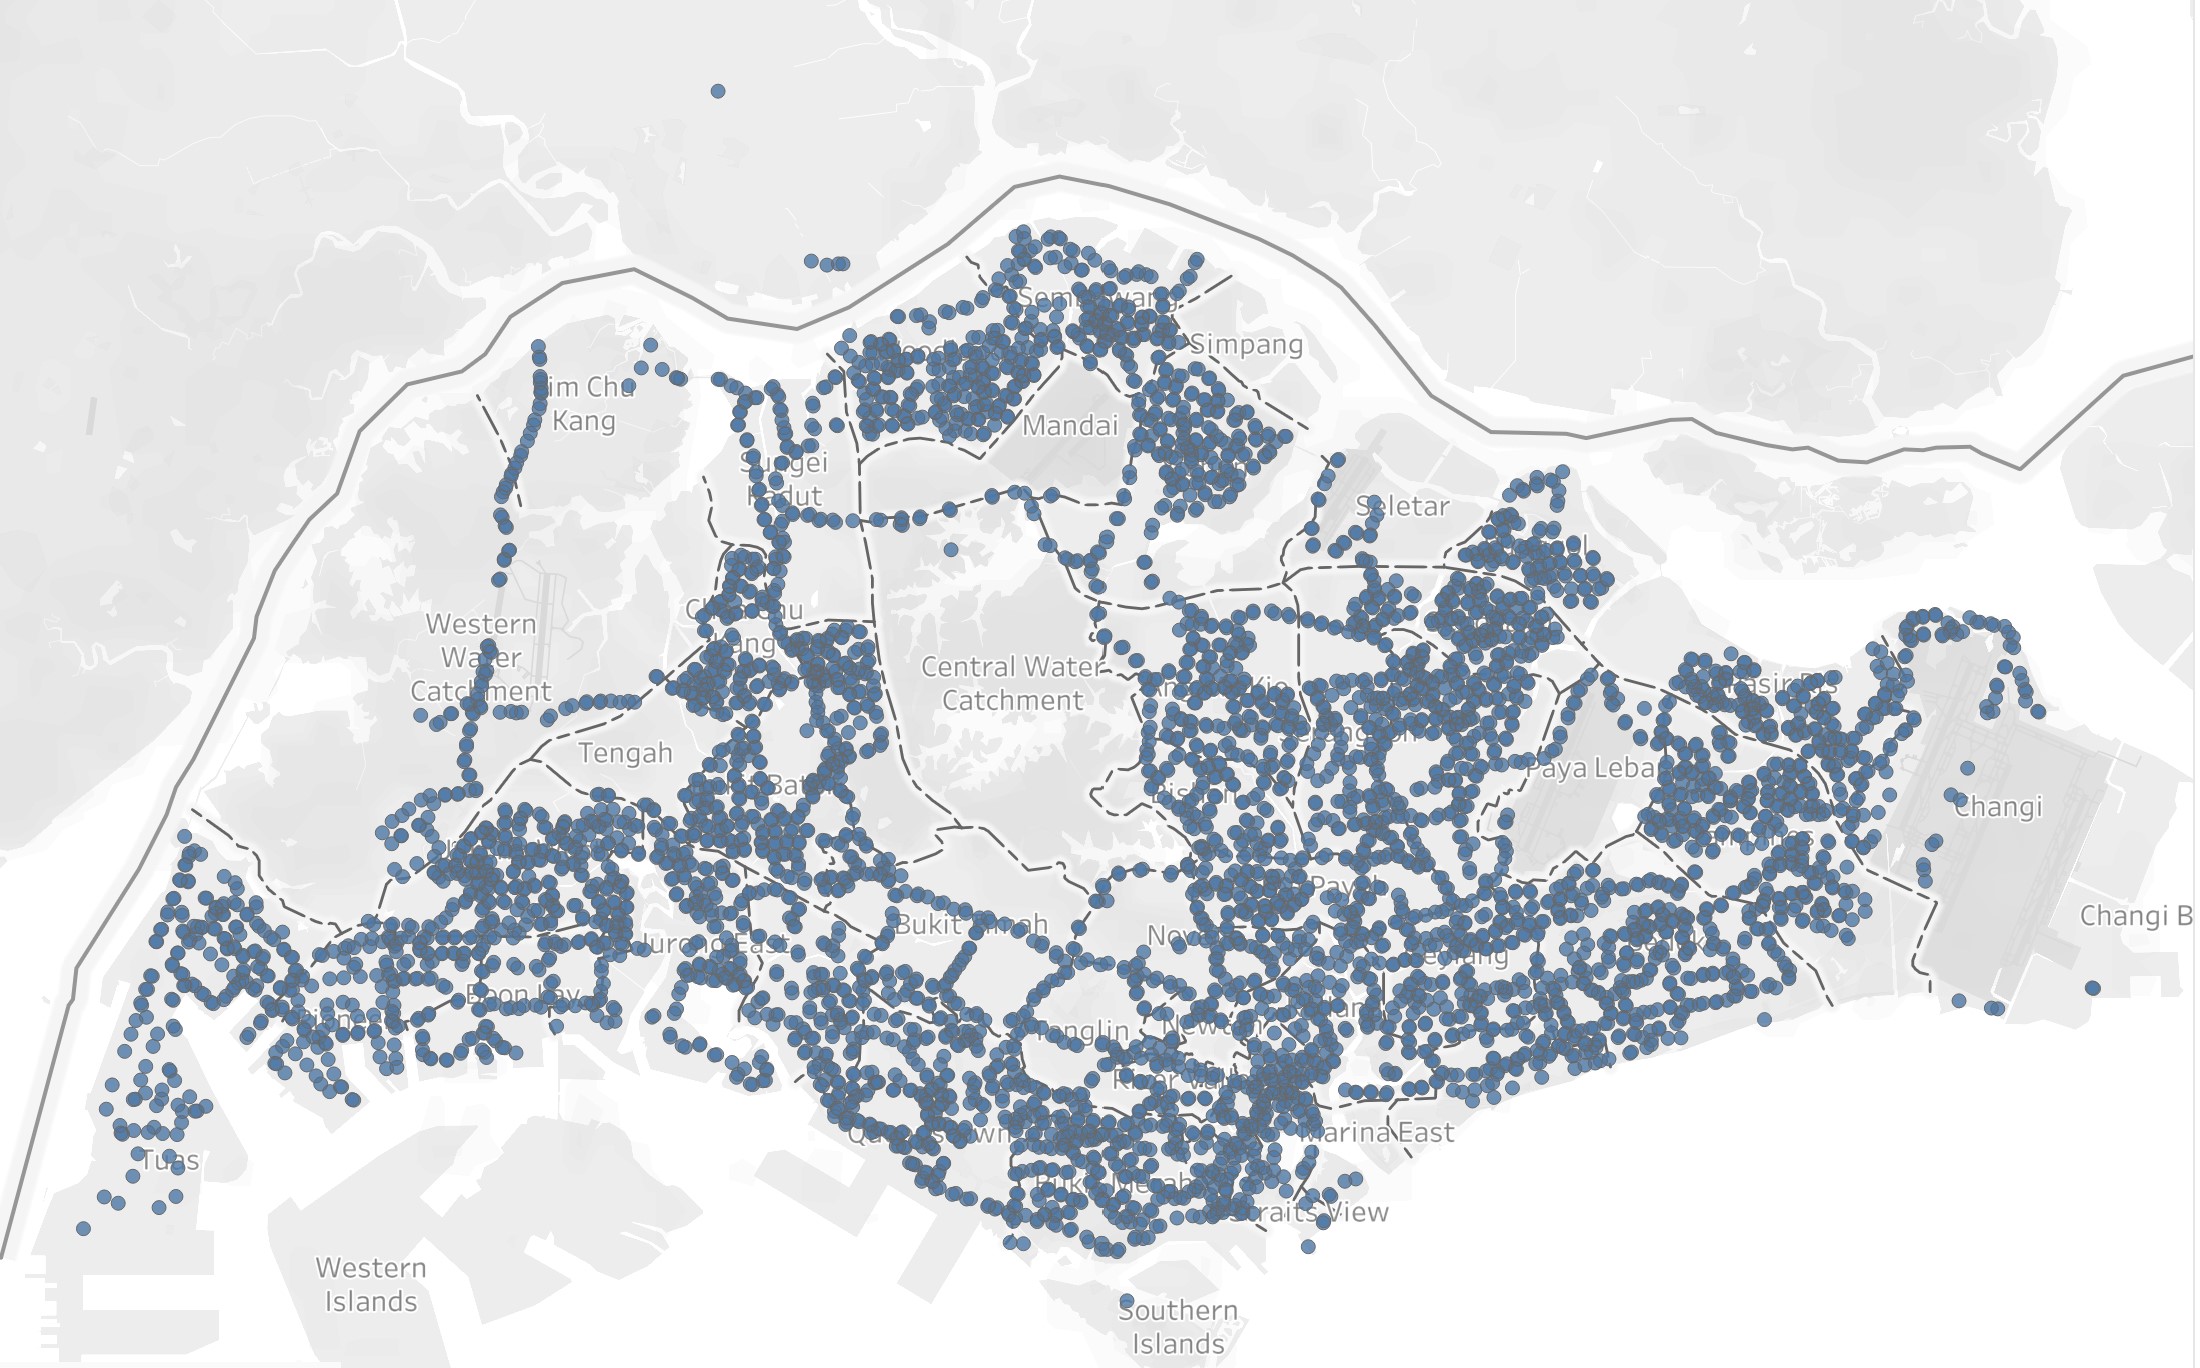
In bus stop dataset, we are interested in which subzone it belongs to, and the geo-spatial location(longitude and latitude) of each bus stop.
In subzone dataset, we are interested in subzone area and its land-use description such as residential, commercial, business, and etc, and the geo-spatial location of each subzone.
In distance dataset, we have the distance between each subzone in matrix.
Methodology
Analysis of passenger volume by bus dataset with background research
Exploratory Data Analysis (EDA) methods in R
Exploratory Spatial Data Analysis (ESDA) methods in R
Regression methods for aspatial and geospatial information in R
Time series analysis for temporal information in R
Clustering methods for aspatial and geospatial information in R
Quarto development for functionality checks
R-Shiny app development for user interactivity
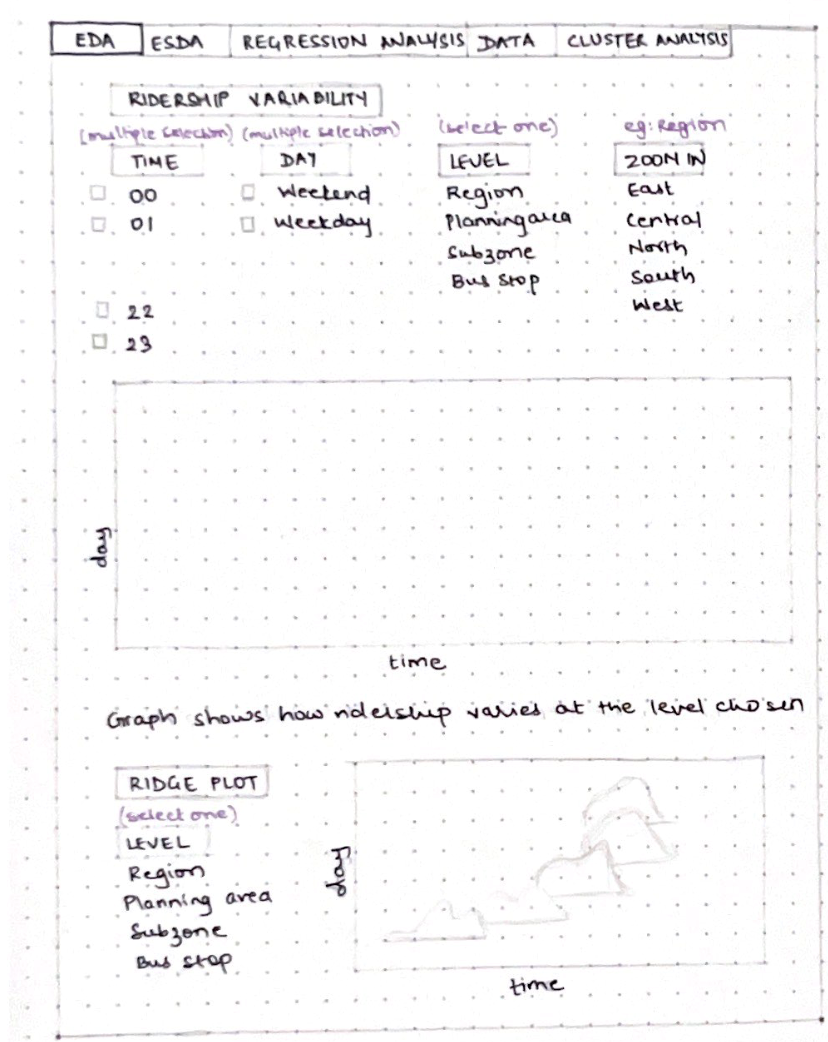
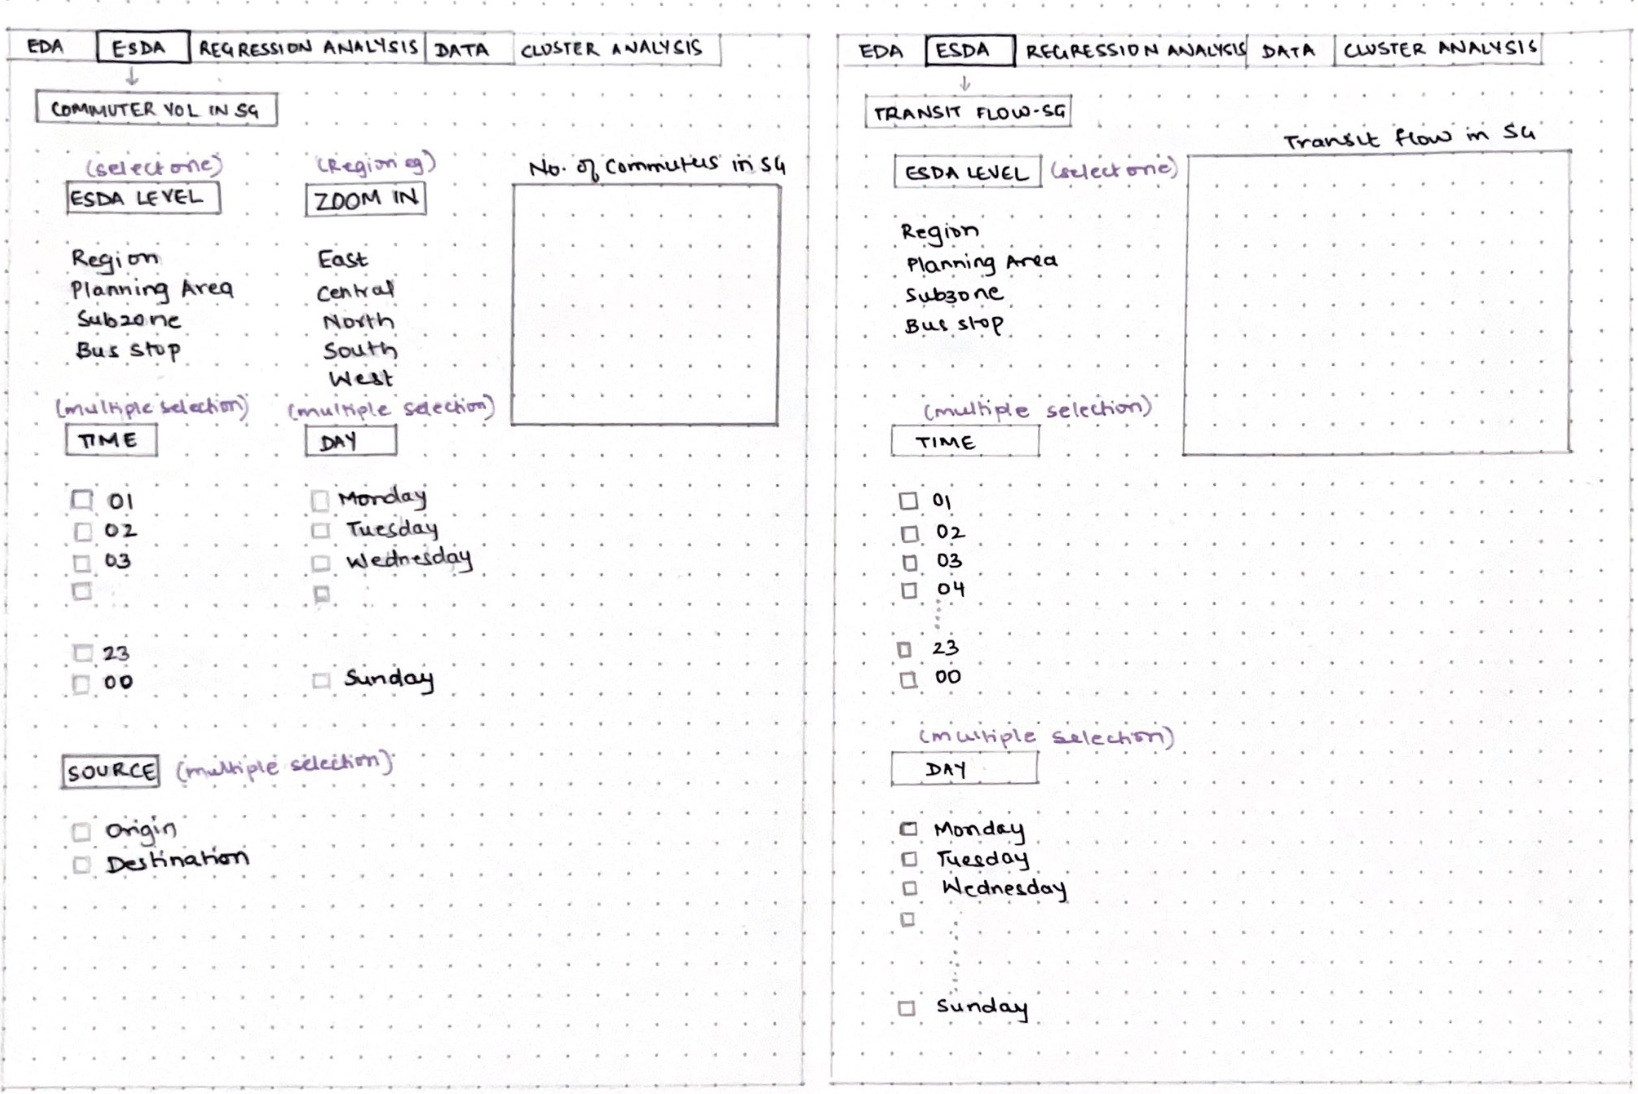
Dashboard Design
The dashboard will be split into 5 sections, where the users are recommended to go through the sections sequentially.
R Packages
| R Packages | Brief description | More information |
|---|---|---|
| tidyverse | The tidyverse designed for Data Science. It helps with importing, wrangling, programming and modelling of data | https://www.tidyverse.org/ |
| stplanr | stplanr is a package for sustainable transport planning with R. | https://cran.r-project.org/web/packages/stplanr/vignettes/stplanr-paper.html |
| shiny | Enables interactivity in data and analysis in R | https://shiny.rstudio.com/ |
| ggplot2 | EDA and data visualisation | https://ggplot2.tidyverse.org/reference/ |
| ggridge | To visualise changes in distribution over time and space | https://cran.r-project.org/web/packages/ggridges/vignettes/introduction.html |
| gganimate | Enable animations in graphs | https://cran.r-project.org/web/packages/gganimate/gganimate.pdf |
| plotly | Create interactive plots in R | https://plotly.com/r/ |
| gtsummary | Save regression model in table form | https://www.danieldsjoberg.com/gtsummary/ |
| rgdal | Spatial data handling | https://cran.r-project.org/web/packages/rgdal/rgdal.pdf |
| sf | Encode spatial vector data | https://cran.r-project.org/web/packages/sf/sf.pdf |
| cluster | Cluster analysis in R | https://cran.r-project.org/web/packages/cluster/cluster.pdf |
| ClustGeo | Creates ward-like hierarchical clustering algorithm including spatial/geographical constraints | https://cran.r-project.org/web/packages/ClustGeo/ClustGeo.pdf |
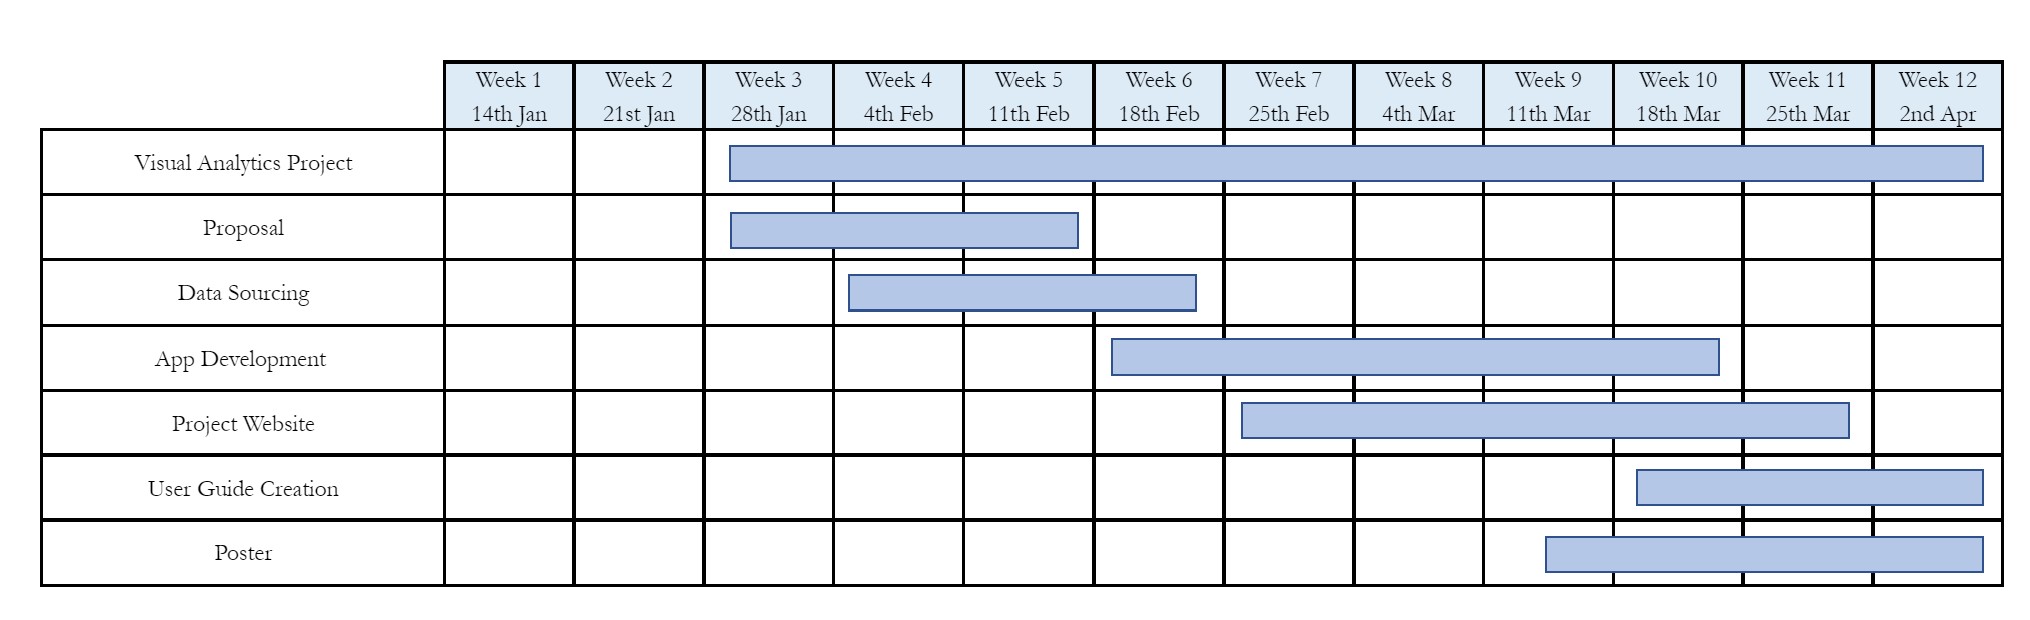
Milestones
Reference
Chua, A., & Wang, S. (21 April, 2020). Understanding Urban Activity and Mobility Patterns. Urban Development Authority.
Samuel de Franca M. and Cira Souza P., “Applying Multivariate Geostatistics For Transit Ridership Modelling At The Bus Stop Level,” Bulletin of Geodetic Sciences. 27(2):e2021019, 2021
Alita, D., Putra, A. D., & Darwis, D. (2021). Analysis of classic assumption test and multiple linear regression coefficient test for employee structural office recommendation. IJCCS (Indonesian Journal of Computing and Cybernetics Systems), 15(3).